Sunday 17 May 2015

Lab 12: Unmanned Aerial Systems

The last field methods class of the semester consisted of a trip out to the Priory, the site of the last three labs. This time, one of the students, Mike Bomber, and Dr. Hupy gave a basic tutorial on how unmanned aerial vehicles (UAVs) work in the field. Dr. Hupy began setting up the UAVs near the Priory parking lot which provided a fairly open piece of land away from a high number of traffic.

For most labs this semester, the weather was something that mattered for the comfort of the class, but not necessarily the inability to do the lab itself. With UAVs, however, weather is a limiting factor in the ability to fly a UAV. On this particular lab day, the weather conditions were very spotty with wind speeds of 7 to 9 miles per hour from the south east. The temperature was 52 degrees Fahrenheit.

This was a very step by step process. The majority of the time out in the field was dedicated to planning the mission, checking weather conditions, and checking the UAVs (unmanned aerial vehicles).

Just as the diagnostics were being checked, a battery was put into the remote controller, the connection fried and one of the students and I had to run back to campus to get a new rechargeable battery as well as AA batteries (see figure 1).

Figure 1. Dr. Hupy, Mike, and Zach going through the diagnostic check list before launching the first UAV.


Two UAVs were launched on the field day, the first being the Iris and the second being the Matrix, both were fixed wing UAVs (see figures 2 and 3).
Figure 2. Iris UAV.

Figure 3. Matrix UAV.

The Iris was much smaller and flew without any issues. When the Matrix was launched, the winds had picked up a bit. As the flight was in progress and the auto-pilot was flying the mission, Mike noticed that there were fewer satellites available to the UAV and the winds were starting to pick up and it was visibly noticeable that the UAV was being affected by the wind. Dr. Hupy informed the class that the robots have the capability to autocorrect for factors like wind, but sometimes they overcorrect themselves which makes them become more unstable. Due to this foreseeable issue, Mike instructed Dr. Hupy to abort the mission. Once this button was pressed on the remote, the UAV immediately began descending and landed with success (see figures 4 and 5).

Figure 4. The Iris pre-launch

Figure 5. Dr. Hupy controlling the UAV in manual mode before turning the controller onto 'mission mode'. 
After the launches were done, some member of the class used the TopCon HiPer to survey GPS points around the flight site. This would allow the imagery from the UAV to be later synced in the lab with the GPS data to provide a spatial existence for the imagery (see figure 6).
Figure 6. The Topcon HiPer was used again in this lab to determine GPS locations around the flight site. This would allow the imagery from the UAV to be later synced in the lab with the GPS data to provide a spatial existence for the imagery.


I really enjoyed this lab because I got to see a UAV in action after hearing about both the controversy and benefits of using them. In addition, lab 4's topic was about unmanned aerial systems mission planning. During that lab, the class used a flight simulator and experienced a small taste of what can all go wrong in a flight mission. To be able to see that in the field gave the class a more wholesome understanding of the technology in action.

To me, it was incredible at the precision and ability that a UAV possesses. Watching Dr. Hupy create the flight path on the iPad was incredible. I did not think that it would have been such a simple process, seeing as it seems to me that UAV technology is just gaining popularity in the hobby world.

Before we even left the field, we were able to see the imaging from the UAVs' flight. Dr. Hupy explained that this was a newer capability of technology. It used to be that one needed to process the imaging once going back into the lab. Because of the delay in imagery, it was often realized that there were glitches in the camera or other issues that would require another trip to the same field site. With the current technology, time and money is saved by being able to see the imagery right away (figures 7 and 8).

Figure 7. The processed aerial imagery post flight.

Figure 8. One image from the UAV in flight. The class can be seen in the top portion of the picture. The UAVs

I feel very fortunate to be able to have the chance to work with UAVs at my university. Such technology is a small area of geography, but with the capabilities of sensors and high resolution technology, UAVs are becoming extremely useful for geographers as well as the rest of society.

Tuesday 12 May 2015

Lab 11: Navigation with GPS

Introduction:

This lab was a continuation of last week's orienteering at the Priory. This week, however, was focused on creating a new orienteering course for the next field method's class in the fall. This involved using a GPS, as well as the navigation map used previously in labs 3 (Development of a Field Navigation Map) and 10 (Orienteering at the Priory).

The location of the orienteering course, the Priory, is a plot of land owned by the University of Wisconsin- Eau Claire, located 3 miles south of campus (see figure 1). This site is used for multiple purposes by the university including child care, student housing, and research projects conducted by university students. Most of the 112 acres are wooded, with a small portion of that land being the buildings for housing and child care. This wooded and hilly area provides a great place to hone in on orienteering skills.

Figure 1. Map of Eau Claire Wisconsin, which highlights the University of Wisconsin- Eau Claire and the Priory. The orienteering area at the Priory is highlighted above.

During this field day, the weather was absolutely perfect and gave the class a nice bit of sun on the skin. This made determining the precise location of points more thought out in the visibility of the trees from the orienteering direction of travel as well as pleasantness of the activity as a whole.

Methods:

Prior to going out into the field, ArcMap was used to plot roughly where 5 navigation points would be located on the Priory grounds for the orienteering course. The course was chosen based on elevation change, distance from point to point, and ability for the course to be mostly independent from the other courses being made by classmates at the Priory. This map was then exported to the Trimble Juno GPS device so the map could be viewed in the field and the exact GPS points could be taken (see figure 2).

Figure 2. Trimble Juno which was used in the field to collect navigation points on the orienteering course. This was then imported into ArcMap to create a navigation map for next semester's field methods class.

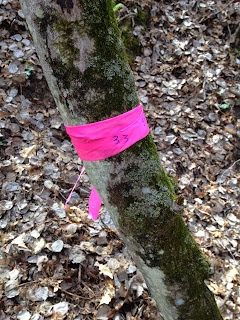
Once at the Priory all of the groups, which were the same as the week before, crosschecked with each other to make sure that the orienteering courses were in different parts of the Priory. Once this was done, every group was given a Sharpie and pink tape. These would be the means in which to mark the trees that served as the individual navigation points. Prior to entering the field, the group  referenced the points taken on the Juno prior to getting into the field and placed them roughly where they should have been placed on the map. This allowed the group to 'orienteer' to the points that were tentatively marked on the map. Our group number was 3, so all of the navigation points are marked 3.1. 3.2... (see figure 3).


Figure 3. This is the navigation map that was used as a reference in the field. The group referenced the points taken on the Juno prior to getting into the field and placed them roughly where they should have been placed on the map. This allowed the group to 'orienteer' to the points that were tentatively marked on the map. Our group number was 3, so all of the navigation points are marked 3.1. 3.2...
At each navigation point, the pink tape was wrapped around the tree roughly 5 feet off the ground. On the tape, Sharpie was used to identify which navigation point was which on the course. A picture was then taken of the tree and the Juno was used to create a GPS point on the exact location of the navigation point (see figures 4 through 7). 
Figure 4. Navigation point 3.1. The number of the navigation point was marked in Sharpie on the tape.
Figure 5. Navigation Point 3.2.
Figure 6. Navigation point 3.3.
Figure 7 . Navigation point 3.5.


Once all of the points were collected in the field, the Juno data was imported back into ArcMap to be made into an orienteering course map (see figure 8).


Figure 8. Final orienteering map with the 5 exact GPS points. This map can be used for next semester's field methods class. The scale bar was done in meters to be comparable to the 'pace count' that was set at the beginning of the semester that was based on pace for 100 meters. 

Discussion:

Because of the dense tree cover it was initially difficult to get a signal to show up for the GPS. The Juno worked fine throughout the lab after walking into a clearing and giving it time to find a signal.

Once reconnecting the Juno to the desktop, it took quite some time to be able to import the data. The device said that no information could be checked in because the file type was unable to be exported. After a lot of troubleshooting done by one of my group members, the data was finally able to be imported.

After completing the field portion of this lab, it was interesting to hear how other groups found their predetermined navigation points. One group used the locator arrow on the Juno and followed it to their predetermined point. By using this, they did not have to go through the means of actually orienteering.

Conclusion:

I really enjoyed partaking in the entire process of completing a navigation map for an orienteering course, doing the actual orienteering, and then making my own orienteering course based on all of the skills learned in previous labs. I liked the refresher on how to use the Juno in the field and the combination of old school map and compass work of orienteering combined with the hi-tech use of the Juno to map GPS points. It makes you realize that you need to know how to use new technology as well as remain familiar with using a map.

I recently went on another orienteering course in northern Minnesota, and I soon realized that the points were 'off' in relation to the course. Because of that, I spent over 30 minutes attempting to find a point that was supposed to be located along a power line, which should have been easy. However, it was not located between the contour lines it should have been, so my ability to complete the course was affected.

Monday 4 May 2015

Lab 10: Orienteering at the Priory

Introduction:

This week's lab took the class out orienteering in wooded property owned by the university. Orienteering is often viewed as a competitive outdoor hobby that requires navigating from given point to point in unfamiliar territory using only a compass and map. This lab is very different from other labs in that no modern technology is used. This can be helpful in the real world in times of technology failure and the like.

The location of the orienteering course, the Priory, is a plot of land owned by the University of Wisconsin- Eau Claire, located 3 miles south of campus (see figure 1). This site is used for multiple purposes by the university including child care, student housing, and research projects conducted by university students. Most of the 112 acres are wooded, with a small portion of that land being the buildings for housing and child care. This wooded and hilly area provides a great place to hone in on orienteering skills.


Figure 1. Map of Eau Claire Wisconsin, which highlights the University of Wisconsin- Eau Claire and the Priory. The orienteering area at the Priory is highlighted above.

A map was created in lab 3 (see figure 2) that depicted the area of the Priory using a Universal Transverse Mercator coordinate system. Because the grid is divided by meters, not degrees, it proves very helpful in navigating with a map. This is because one can easily determine distance using the grid system and not just the scale bar. In addition, knowing one's pace for 100 meters gives the map user the ability to physically pace out the intended distance from point to point. In lab 3, the class individually measured their pace count to reach 100 meters; this information played an important role in being able to estimate distance in the field during this lab.

Figure 2. This navigation map was created back in lab 3 to illustrate the orienteering course at the Priory.  The digital elevation model (white to green coloration), imagery, and contour lines were included on the map to aid in the ability to 'orient' ones' self while orienteering.


Methods:

The class was split into teams of 3 and given 5 UTM coordinates to find in the woods. First, the route needed to be mapped out from the given UTM coordinates (i.e. point 1-2, point 2-3…etc.). This would then allow the groups to determine how far each point was from one another and determine the number of paces that it would likely take to get from point A to point B (see figures 3 and 4).

Figure 3. This is this area in which the orienteering course took place.  There was a miscommunication between the class and the professor about where the point boundary for the course would take place. Ergo, some of the orienteering points assigned to the class ended up outside of the visible map and onto the legend.


Figure 4. Instead of the originally thought orienteering boundary (the yellow rectangle), the course ended up taking place in the red circle, which prevented the digital elevation model (white to green coloration), imagery, and contour lines to be seen. This could have effected the efficiency in which the groups were able to navigate their orienteering points.


Three people in the group were needed in order to effectively and efficiently take on the orienteering course. It could have been done with less people, but it could have been harder to keep track of the angle of travel, distance etc.

One person generally oriented the compass and the map. To do such, the compass was placed on the map and its edge was used to determine the azimuth between point A and point B, for example. This was done by facing the 'direction of travel' end of the compass toward the direction of travel on the map  (see figure 5). If this is facing the opposite way during the orienting step, the orienteers will go in the opposite direction of desired travel. Next The dial on the compass needs to have the north facing the north on the map. Once this is done, you put 'red' in the 'shed' and follow 'Fred' meaning that you turn with the compass parallel to the ground until the moving arrow (red), into the red area on the compass (shed), and then follow the 'direction of travel' arrow (Fred), until you reach your destination. Keep in mind, that the moving arrow must stay facing north for the entirety of travel.


Figure 5. Note the 'start' and 'destination' line on the left side of the compass. The compass's straight edge serves as the intended path of travel. Also notice how the 'direction of travel' arrow on the compass faces the 'destination' point on the map, this is a vital step in the process. The dial on the compass needs to have the north facing the north on the map. Once this is done, you put 'red' in the 'shed' and follow 'Fred' meaning that you turn with the compass parallel to the ground until the moving arrow (red), into the red area on the compass (shed), and then follow the 'direction of travel' arrow (Fred), until you reach your destination. Keep in mind, that the moving arrow must stay facing north for the entirety of travel.

Another member of the group would then hold the compass and be in charge of maintain the direction of travel. As the stood stationary, a runner would go ahead of the group and the compass holder would tell the runner to go left or right in order to be in line with the direction of travel. The third person was the pacer, who used their pace count (determined back in lab 3) to determine the approximate distance from one point to the next. This method worked very efficiently, as we were able to locate all of the points with relative ease. Below are a couple of pictures that indicate what the tagged orienteering trees looked like (see figures 6, 7, and 8).  
 

Figure 6. As is fairly clear, seeing pink tape is not always as easy as it looks. The class was told that all of the orienteering points would be located on birch trees, which helped, but it was still somewhat difficult to seek out the marked trees.


Figure 7. Here I am holding a part of the pink tape around the orienteering destination points. The points were located on birch trees, which aided in navigation.

Figure 8. A close up image of the pink taped destination points. The words 'pt 2' helped indicate the orienteering point destination, which helped in reassuring location during orienteering.
 
Discussion:

One of the issues we ran into was the location of the point boundary on the UTM map that was used. The topography was basically obsolete because the legend was in the way of the orienteering location as a result of a miscommunication of the class with Professor Hupy. This meant that we had to strictly rely on the use of our pace count. Most of the time we would underestimate the size of our footsteps and end up at our destination before we finished pacing out the number of steps we thought it would take us to finish.What made the pacing difficult was the elevation change which made it difficult to gauge the size of steps. This, in turn, created more of a guessing game for finding the orienteering points. However, although our pacing was off, the angle of direction was always correct, so having one out of the two orientations worked out just fine!

Another issue right from the start of the orienteering experience was the estimation of the location of the points on the map. Given that the UTM was grid was marked every 50 meters, there was quite a bit of room for estimation error. This was proven when my partners and I compared our hypothesized orienteering points; none of them were truly accurate so we had to estimate the points' location, meaning that the angle of the path was always 'off' a bit. This was not a big deal in a small area such as the Priory, but it would play a more important role in a larger orienteering course.

Our group did not have this issue, but some groups had a difficult time using their map because their grid system lacked detail. The grid that was used in our map was 50 by 50 meter, and quite honestly it could have been increased in detail, however, then the issue comes with visibility of the rest of the map then.

The rest of the map, the imagery, digital elevation model, and contour lines were very helpful and not distracting when navigating at the Priory. However, because the legend was in the way of much of the course, the other features of the map were used a lot less than they probably would have been if the course had been completely visible on the map.

Conclusion:

I had previously done some orienteering, but it is always good to refresh one's skills. The nice thing about orienteering is that virtually everyone can have access to a map and compass, unlike a lot of the other technology that we have been using throughout this semester. In addition, it is a good idea to have this as a back up plan in case all forms of technology fail in the process of navigating in a remote area.

We were also provided a unique experience in being able to design our own orienteering maps to use in the field. Most people orienteering use existent maps, but it gives you a bit more satisfaction when the map you created, in combination with orienteering skills, helps you locate the orienteering points.