Introduction
After creating the geodatabase for the campus microclimate study from the previous lab, it was time to take the geodatabase and put it to the test out in the field. This weeks' lab was to serve as a test run for the official data collection day, which will take place during the next lab. The goal was to figure out all of the short comings of our individual geodatabases and learn from that to create a class 'master' geodatabase in which to collect all of the official GPS points for next week. This required taking out the
Trimble Juno GPS (see figure 1) to record the data in combination with the
Kestrel weather meter (see figure 2) to gather the microclimate data.
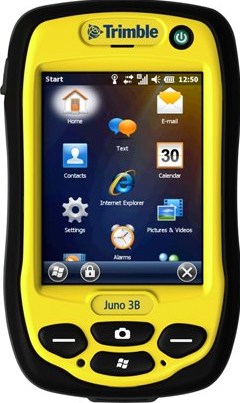 |
| Figure 1. This is the Trimble Juno GPS that was used in the data collection during this lab. It has the capabilities of an ArcPad application which allows for data collection directly into the mobile version of ArcMap. |
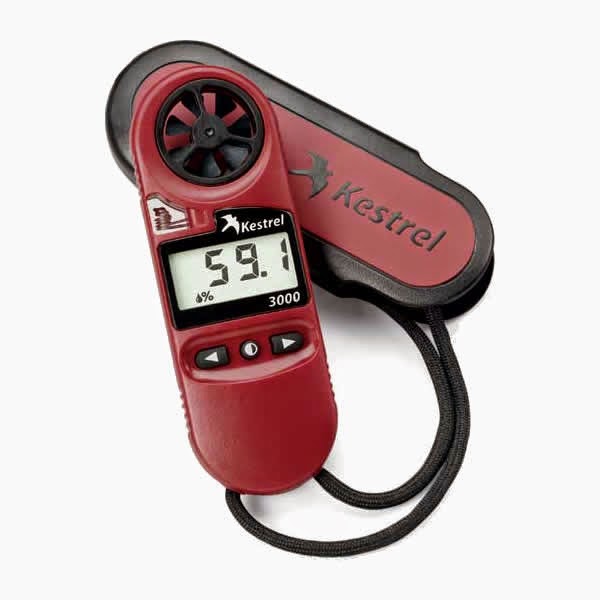 |
| Figure 2. This is the Kestrel 3000, which measured temperature (at the surface and 2 meters), wind speed, wind chill, dew point, and percent humidity for the microclimate data collection in this lab. |
Methods
Some initial work had to be done before going out in the field. This included adding the 'microclimate' feature class as well as a recent campus basemap to ArcMap. The Juno GPS was then connected to the computer via USB to be able to export the ArcMap file to
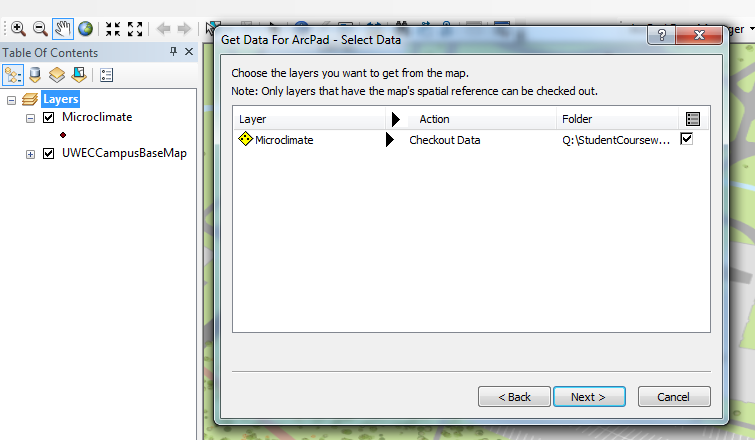
ArcPad (the mobile version of ArcMap). Then the 'ArcPad Data Manager' toolbar and its extension needed to be turned on to enable the data transfer to the Juno. There was an issue with using the basemap that was found on ArcGIS Online (UWECCampusBaseMap) (see figure 3). The 'Get Data From ArcPad' would only process the microclimate feature class, without the basemap (see figure 4). Therefore a different basemap (ortho_1-1_1n_s_wi035_2013_1.sid) was used and the 'Get Data for ArcPad' successfully transferred (see figure 5).
 |
| Figure 3. This is the error pop-up that occurred when attempting to use the 'UWECCAmpusBaseMap' basemap. The operation was successful when using the 'ortho_1-1_1n_s_wi035_2013_1.sid' basemap. |
 |
| Figure 4. This is the unsuccessful basemap and only the microclimate feature class could be exported from this. See below for successful export. |
 |
| Figure 5. This is the successful basemap that included both the microclimate feature class as well as the basemap of the UW- Eau Claire campus. |
After the basemap uploaded to the Juno, it was time to put the 'Microclimate' feature class to the test. Beside for the stylus being touchy and making it difficult to input the data, the collection went off without a hitch. Using the Kestrel weather meter was another story. The temperature reading moved quite slowly from the temperature inside the building to the temperature outside. It was difficult to know when the temperature was truly appropriate for outside.
Following the collection of points throughout campus, it was time to import the data from the Juno to ArcMap. During the initial attempt to import the data, an error occurred, which prevented the data from showing up in an editable format. Some trouble shooting occurred to attempt to resolve the issue, but the only way that was proven to work was to create a new .mxd and import the ArcPad data as well as the 'microclimate' feature class.
When opening up the attribute table for the 'microclimate' feature class, all of the points collected in the field were there, but they appeared twice, while indicating that there were ten points taken, not five (see figure 6). This is an issue that will need to be fixed before next weeks' official data collection.
 |
| Figure 6. The table shown is the attribute table from the points collected from this lab. Notice that points 6-10 are a repeat of points 1-5. This was an error somewhere in the process of collecting the points in ArcPad and transferring the data to ArcMap. |
Discussion
There were quite a few things that went wrong in this lab, mostly before heading out in the field. The most troubling one that occurred for me was not being able to 'Select Data' for the UWECCampusBaseMap. This was solved, however, by using a different base map. In the field, I was mostly successful with my data collection, except that the 'groundcover' field was on a separate page than the rest of the fields, which confused me for a bit.
In addition, it was frustrating to collect the data because there would be times when the ArcPad data collection page would exit without being able to go back and edit the GPS points. This is why there are quite a few 'null' spots on the attribute table (see figure 7).
|
Figure 7. The table shown is the attribute table from the points collected from this lab. The null values are the points where I missed the collection.
|
I used two basemaps to compare how accurate the GPS points were. It was interesting because the precision of the points depended on what basemap was being used. The figure 8 basemap was the one that I used during the process of collecting the points in the field. However, according to where I actually stood, the online campus basemap (figure 9) was actually more accurate. This surprised me, but it is hard to compare two images of very different pixel quality.
 |
| Figure 8. This is the basemap imagery that was brought into the field and imported back into ArcMap. While the points are in the general region, there are a couple that should be on the cement, but appear to be on the grass. |
Below are a series of maps created from the five GPS points taken in the field. Figures 9 and 12 are individual points, but figures 10, 11, 13-15 are interpolation based to show the likely change in data spatially across the campus mall. A couple of maps are missing due to lack of data collected in the field including wind direction and temperature at surface.
 |
Figure 9. This is a zoomed in image of the points taken on campus. The only point on this image that is 'off'' is the bottom right point which should be on concrete. Note that this imagery is slightly different than figure 8's.
|
 |
| Figure 10. Campus Percent Humitidy. The bottom right point was missed during this data collection. |
 |
| Figure 11. Campus Dewpoint. |
 |
| Figure 12. Campus Ground Cover. The ground cover of the campus was not able to be interpolated because it was in the form of text, not short or long integer. |
 |
| Figure 13. The wind chill point was missed in the bottom right, thus creating a much different visual than if the bottom right point had been included. |
 |
| Figure 14. Campus Wind Speed. |
 |
| Figure 15. Campus Temperature at 2 Meters. |
Conclusion
In Geographical Information Systems I, we did a similar GPS project, so it was great to bring back some of the tools I learned last year. It is really wonderful to be able to grow from skills I learned previously in GIS. For that project I created multiple feature classes, but for this one I was able to step it up a couple of notches and create multiple fields within one feature class.
As experienced in class, sometimes there are technical issues that can only be solved by trouble shooting, which can be rather frustrating at times. I have previously stated that this class is really helping me with patience, but that needs to be reiterated after this lab. If at first you don't succeed, try as many ways as you can, seems to be the solution.
No comments:
Post a Comment